Grafana là gì?
Grafana là gì ? Grafana là một giao diện/dashboard theo dõi hệ thống (opensource). Hướng dẫn tìm hiểu Grafana là gì và Prometheus để monitor server Công cụ cho phép giám sát trực quan hóa dữ liệu, có thể tạo các cảnh báo, bộ lọc đặc biệt cho dữ liệu.
Tại sao sử dụng Grafana
- Grafana là gì: Sử dụng để giám sát cơ sở hạ tầng.
- Giúp theo dõi người dùng, sự kiện dễ dàng vì nó tự động hóa việc thu thập, quản lý và xem dữ liệu.
- Các nhà lãnh đạo, phân tích bảo mật, nhà phát triển,… sử dụng dữ liệu được phân tích, được trực quan hóa để đưa ra các quyết định của họ.
- Sử dụng nguồn dữ liệu đa dạng (AWS CloudWatch, Microsoft SQL Server, Prometheus, MySQL, InfluxDB,…
- Trực quan hóa đa dạng, có nhiều tùy chọn để trực quan hóa.
- Cho phép đưa ra các cảnh báo thông qua Slack, PagerDuty khi một chỉ số dữ liệu đạt được một ngưỡng được đặt trước.
- Có thể tập hợp dữ liệu với nhau từ các nguồn khác nhau.
- Trang tổng quan: trực quan hóa dữ liệu với báo cáo mẫu hoặc tùy chỉnh theo mục đích, cho phép chia sẻ báo cáo.
Cài đặt
Cài đặt Prometheus
Là một hệ thống mã nguồn mở, sử dụng để giám sát dựa trên các số liệu. Nó thu thập dữ liệu từ các service và host. Dữ liệu sau đó được lưu trong cơ sở dữ liệu chuỗi thời gian (time-series database)
Download
cd /tmp
wget https://github.com/prometheus/prometheus/releases/download/v2.36.2/prometheus-2.36.2.linux-amd64.tar.gz
Unzip


tar -xzf prometheus-2.36.2.linux-amd64.tar.gz
Move to /opt
sudo mv prometheus-2.36.2.linux-amd64 /opt/prometheus/
cd /opt/prometheus/
Add user
$ sudo useradd -s /sbin/false prometheus
Add permission and ownership
$ sudo chmod 775 .
$ sudo chown -R prometheus:prometheus .
Setup prometheus as a service
$ sudo nano /etc/systemd/system/prometheus.service
[Unit]
Description=Prometheus Server
Wants=network-online.target
After=network-online.target
[Service]
User=prometheus
Group=prometheus
Type=simple
ExecStart=/opt/prometheus/prometheus
--config.file=/opt/prometheus/prometheus.yml
--storage.tsdb.path=/opt/prometheus/
--web.console.templates=/opt/prometheus/consoles
--web.console.libraries=/opt/prometheus/console_libraries
[Install]
WantedBy=multi-user.target
Start Prometheus
$ sudo systemctl daemon-reload
$ sudo systemctl start prometheus
$ sudo systemctl enable prometheus
$ sudo systemctl status prometheus
Open browser on port 9090

Cài đặt Grafana
Add key to APT key
$ wget -q -O – https://packages.grafana.com/gpg.key | sudo apt-key add –
Add Grafana repository to APT sources
$ sudo add-apt-repository “deb https://packages.grafana.com/oss/deb stable main”
Update packages
$ sudo apt update
Install Grafana
$ sudo apt install grafana
Start Grafana server
$ sudo systemctl start grafana-server
Show status Grafana server
$ sudo systemctl status grafana-server
Enable Grafana at boot time
$ sudo systemctl enable grafana-server
Open Browser on port 3000

Cài đặt Node Exporter
Là package chính thức được sử dụng để lấy nhiều thông tin phần cứng và các thông số hệ điều hành linux.
Download
$ cd /tmp
$ wget https://github.com/prometheus/node_exporter/releases/download/v1.0.0-rc.1/node_exporter-1.0.0-rc.1.linux-amd64.tar.gz
Unzip
$ tar -xzf node_exporter-1.0.0-rc.1.linux-amd64.tar.gz
Move to /opt/node_exporter
$ sudo mv node_exporter-1.0.0-rc.1.linux-amd64 /opt/node_exporter
$ cd /opt/node_exporter
Setup Node Exporter as a Service
$ sudo nano /etc/systemd/system/node_exporter.service
[Unit]
Description=node_exporter
Wants=network-online.target
After=network-online.target
[Service]
User=prometheus
Group=prometheus
Type=simple
ExecStart=/opt/node_exporter/node_exporter
[Install]
WantedBy=multi-user.target
Start Node Exporter
$ sudo systemctl daemon-reload
$ sudo systemctl start node_exporter
$ sudo systemctl enable node_exporter
$ sudo systemctl status node_exporter
Add Node Exporter to Prometheus
Edit prometheus.yml
$ sudo nano /opt/prometheus/prometheus.yml
...
scrape_configs:
  ...
  - job_name: 'node_exporter'
	  static_configs:
	    - targets: ['localhost:9100']
...
Restart Prometheus
$ sudo systemctl restart prometheus
Check targets
- open
Prometheus on browser→Status→Targets

Tích hợp Prometheus vào Grafana
Open Grafana → Configure
Chọn Data source -> Add data source -> search prometheus
set url = http://localhost:9090 → save

Tạo dashboard
Chọn Dashboards → import

Set ID = *1860 → load*
Set Prometheus = Prometheus → import
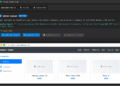
Kết quả:
Chúc các đồng chí thành công

Chọn
last 15 minutes và refesh 1m ở góc phải phía trên